Memory Leak Caused by Using Go STL to Query DB
Problem Origin
Recently, a Go API service was found to have continuously increasing memory usage through regular monitoring. The memory usage rose from the initial 70MB to over 1GB until it ran out of memory and crashed. This clearly indicated a memory leak issue. Since memory leaks rarely occur in languages with built-in garbage collection, if there is one, it must be a significant problem. Therefore, the following detailed investigation process was carried out to accumulate experience for handling similar issues in the future.
Analysis and Investigation
Goroutine Leak
I had previously heard a famous saying: “Nine out of ten memory leaks in Go are due to goroutine leaks.” Is this really the case? Regular queries of runtime.NumGoroutine() can help us determine this, or if pprof is enabled online, we can visit /debug/pprof to see the number of goroutines. I used expvar to periodically expose the total number of goroutines and regularly collected the online data locally.
1 | // server.go |
The done channel is returned so that we can gracefully exit when shutting down the system. After some time of data collection and chart analysis, I found that it was not a goroutine leak. If it were, we could view the status of each goroutine online by visiting /debug/pprof/goroutine?debug=1 for further analysis. However, through the process of elimination, this was clearly not the cause of the issue.
Long-term Reference Holding
Now a new question naturally emerges: if the number of goroutines rises and then always manages to fall back, it means that non-resident goroutines can finish normally. We can rule out leaks caused by goroutines being blocked and unable to exit. But can we conclude that memory leaks are completely unrelated to goroutines? The answer is no, because we cannot be sure whether goroutines might cause some of our reference objects to be continuously held. During the Mark phase, these objects that are still being held certainly cannot be garbage collected. If they are being held for some reason and accompanied by new memory allocations, this is the second major culprit leading to continuous memory growth.
So, the problem has shifted to the memory allocation of objects or object groups. This could be a large slice that continuously adds elements while being referenced throughout the object’s lifecycle, or it could be an object holding pointers to other objects, like a linked list reference relationship. If this reference chain keeps growing, it will similarly cause memory leaks.
Using pprof to Sample and Analyze Heap Memory
By obtaining pprof heap profiles, we can directly generate snapshots of the current heap memory allocation online and persist them in the form of .pb.gz compressed packages for further offline analysis.
1 | go tool pprof http://[domain]/debug/pprof/heap |
Using the command line, we can persist the heap memory snapshot and various statistics locally for analysis, entering the pprof interactive command line. I directly captured two snapshots from the production environment at different times for analysis:
1 | File: binary |
1 | File: binary |
Using top, we can view the functions holding the most memory, sorted accordingly. By comparing the functions holding the most memory, I found that although myfuncA held a lot of memory, its memory usage remained unchanged between the two snapshots, while the total memory usage increased from 47MB to 96MB. Therefore, we can rule out myfuncA as the source of the leak. It’s worth noting that not all of the additional 50MB is due to memory leaks; DB query deserialization also requires significant memory allocation. According to Go runtime’s memory allocation strategy, GC does not immediately reclaim this memory, and even if it does, it won’t quickly return idle memory to the OS. This memory will still exist in the memory allocator’s multi-level memory pool for some time. Therefore, there are still some interfering factors hindering our analysis. By the way, regarding the reflect.unsafe_NewArray function, some people previously suspected it might cause memory leaks. In fact, whenever a JSON is deserialized into a slice, it uses this function to allocate memory. Its upper layer is reflect.MakeSlice, which can create a slice based on type information obtained through reflection, essentially a constructor for a generic slice.
Comparing Differences Between Two Snapshots
Simply visually inspecting the differences between the two snapshots still has a lot of interference. It might be clearer if we could use the first snapshot as a baseline and view the diff results with the second snapshot.
1 | go tool pprof -base pprof.binary.alloc_objects.alloc_space.inuse_objects.inuse_space.001.pb.gz pprof.binary.alloc_objects.alloc_space.inuse_objects.inuse_space.002.pb.gz |
1 | File: binary |
By specifying the baseline with -base and using top again, we can accurately list what makes up the extra 50MB. Categorizing these listed methods: funcA is the controller function, and funcB is the M-layer method called by A that directly interacts with PostgreSQL to obtain data. The rest includes standard library functions for deserializing JSON data fields and functions related to database connections. Initially, we can be certain that the memory leak exists somewhere in this method call chain.
In the interactive command line, using list methodName allows us to analyze the specific usage situations step by step along the method call chain. Excluding the interference of memory allocation for deserialized objects and combining with the occupancy situation of snapshot 2, we can locate the *DB and *conn objects, with method calls pointing to the Preparex method provided by sqlx and the Get method of the Stmt object produced by Preparex.
1 | func (r repoXXX) FindByID(id string) (*T, err) { |
Finding the Culprit
sqlx is just a simple wrapper library for database/sql. To understand what these two methods actually do, we need to start from database/sql.
DB Creation
1 | func Open(driverName, dataSourceName string) (*DB, error) { |
OpenDB() is obviously the DB constructor, let’s continue
1 | func OpenDB(c driver.Connector) *DB { |
Several key components:openerCh is used to cache requests for creating new connections, with a single purpose and following a first-in-first-out logic, defined as chan struct which is perfect for this use case
resetterCh is used to asynchronously reset the connection’s context and return the current connection’s query execution error
Two goroutines asynchronously execute the above two operations
lastPut is used for debugging, we’ll skip it
connRequests is used for asynchronous request queuing when there are no idle database connections and no new connections can be created. The key is incremental, and the value uses a channel to prevent blocking when reading. The length can easily be used for counting.
1 | func (db *DB) putConnDBLocked(dc *driverConn, err error) bool { |
So far, we know that connRequest represents a request to create a new connection, and connRequests is used for global request queuing. Whenever there’s a request to create a new connection, DB tries to reuse available driverConn to satisfy these requests. Note that these are not query requests, but requests to create connections.
Recording Resource Dependencies
The DB object’s conn method is responsible for obtaining connections. Once we have a connection, we can send our statements to the database. Taking a SELECT statement query as an example:
1 | func (db *DB) query(ctx context.Context, query string, args []interface{}, strategy connReuseStrategy) (*Rows, error) { |
Let’s not go too far ahead, as we’re not using this method to access the database. But the above call can help clarify how the standard library organizes these underlying objects. Now, let’s get back to sqlx’s preparex method, which is where our problem begins. It ultimately calls the PrepareContext method of the standard library’s DB:
1 | func (db *DB) PrepareContext(ctx context.Context, query string) (*Stmt, error) { |
1 | func (db *DB) prepare(ctx context.Context, query string, strategy connReuseStrategy) (*Stmt, error) { |
The prepare method here is very similar to the query method mentioned earlier. We’ll discuss their differences later. For now, let’s continue following the prepareDC clue.
1 | // cg being nil means the connection pool is enabled! (emphasizing this point) |
The returned stmt is the product of Preparex, which then executes Get. After sqlx’s wrapper, it ultimately calls the standard library’s func (s *Stmt) QueryContext and sqlx’s func (r *Row) scanAny.
It’s certain that after calling Preparex, the stmt reference is held by db. As long as the db object exists, for stmt to be released, there must be corresponding code to manually remove the reference to stmt. Let’s briefly look at QueryContext to see if there’s an operation similar to removeDep that we’re looking for:
1 | func (s *Stmt) QueryContext(ctx context.Context, args ...interface{}) (*Rows, error) { |
Yes, but these are codes for recording references to rows and reusing database connections, not for releasing the stmt object. Similarly, looking at sqlx’s scanAny, it mainly serializes the data returned by the database to specific fields in the struct passed to Get by calling Scan.
The above findings confirm the culprit of this memory leak: db.dep, a dictionary used for reference counting to ensure that dependencies are released first. This dictionary ensures that only after the element’s dependencies are released can the current element be released, calling the current element’s finalClose method to release the resources held by the current element.
Solving the Leak
Therefore, to solve this memory leak, we must make dep release its reference to stmt. Through a simple search of the sql.go file, the release of the stmt object is hidden in its close method.
1 | func (s *Stmt) Close() error { |
One line of code can solve it:
1 | stmt, _ := r.Preparex(`MY SQL QUERY`) |
After redeployment and sampling the memory usage, the results are shown in the following figure:
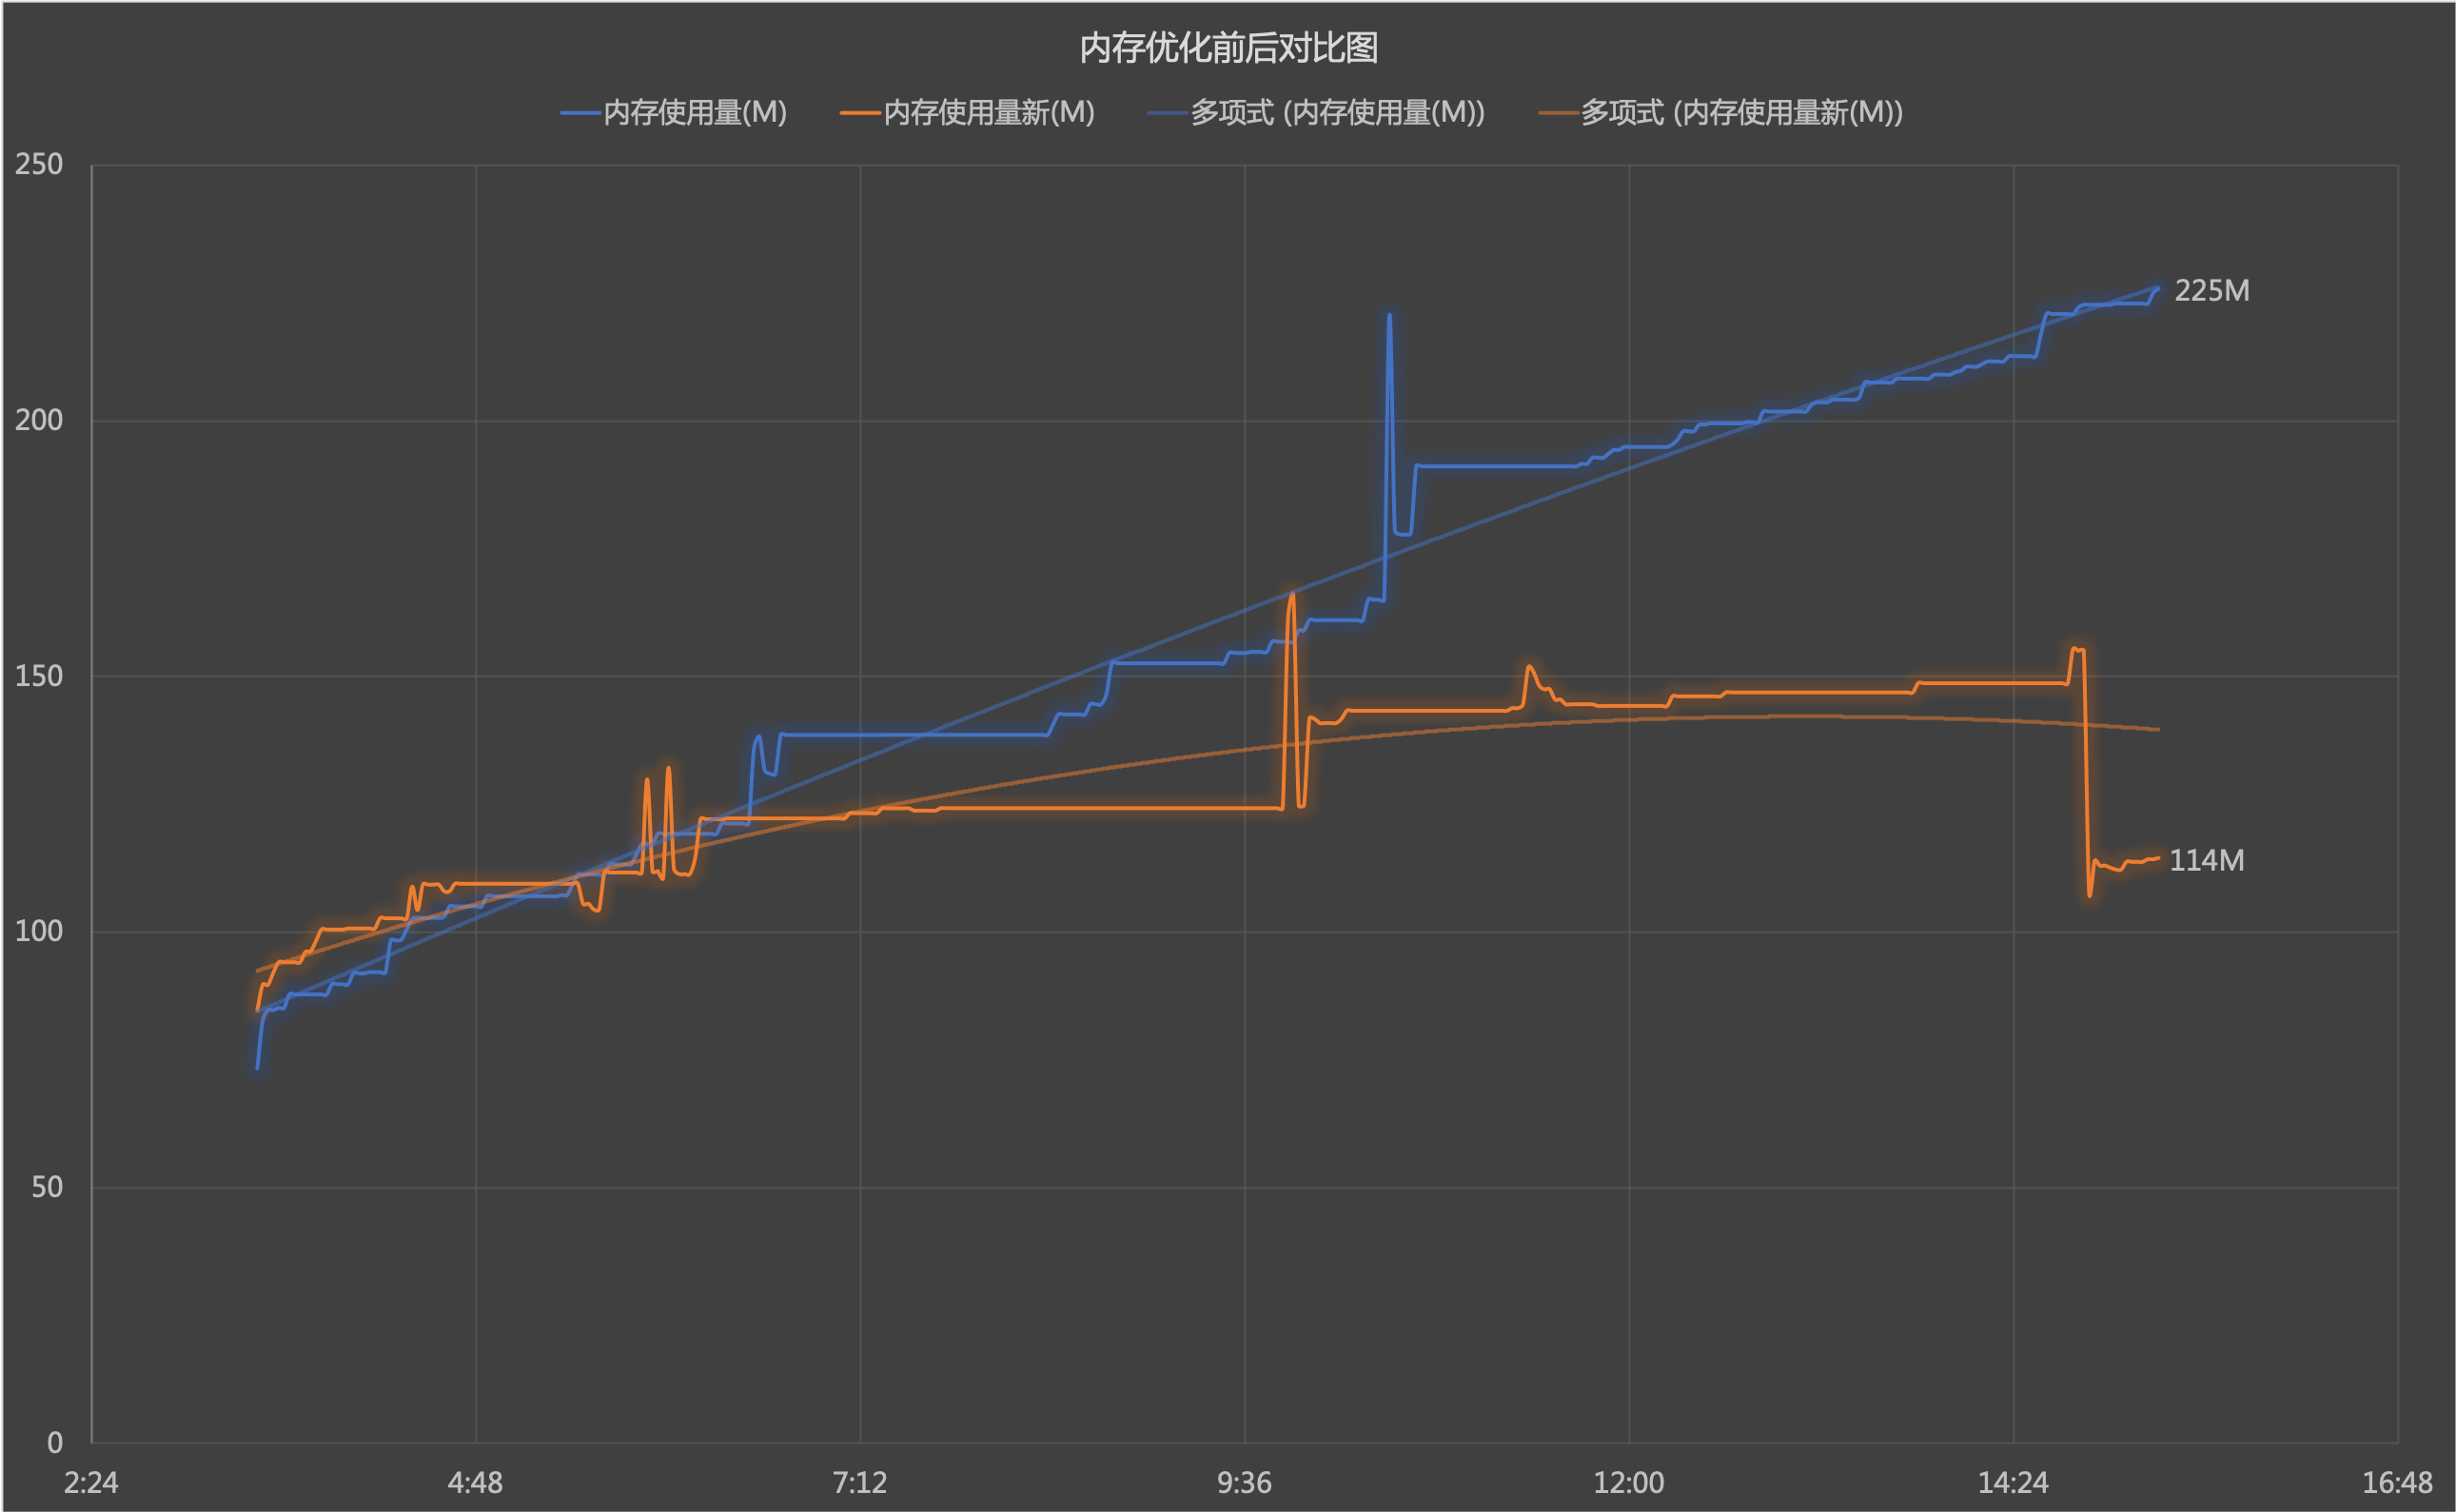
GC can now properly reclaim the stmt object. Problem solved!
Conclusion
Lessons learned:
- Early stage: Perform load tests, solve issues offline if possible; make good use of pprof; write good documentation to avoid others falling into the same trap
- Production: Ensure monitoring and alerting are in place, memory usage exceeding a certain threshold must be taken seriously, make good use of
http/pprof - Regular practices: Become more familiar with frequently used packages and standard libraries, especially the standard library, as it hides many details that can easily lead to issues if overlooked
Other Potential Leaks (Bonus)
Honestly, this is not the first memory leak I’ve encountered in Go, but Go indeed doesn’t easily have such issues. Through reflection on my multiple encounters with such issues, I’ve found that some goroutine-caused memory leaks can be quickly resolved through pprof or monitoring. Instead, it’s the long-term held references that are easily overlooked. These leak signs often appear in:
- Manually maintained object pools
- Manually controlled system resources: such as timers, connections, IO buffer streams, etc.
- Numerical limits with no default upper bound: such as db.maxOpen
Memory Leak Caused by Using Go STL to Query DB
https://blog.tecknight.xyz/2020/03/05/en/Memory-Leak-Caused-by-Using-Go-STL-to-Query-DB/